
Limited Early Adopters Program for high-risk industries now open Get Early Access โ†’
Back to Blogs

Why Formatted Spreadsheet Systems Fail HSE Managers in Oil & Gas Operations

July 10, 2026

Oil & Gas Operations

Most spreadsheet-based HSE systems are updated every week. Far fewer are trusted the day an auditor, an incident investigator, or a corporate EHS director asks a question that spans more than one file.
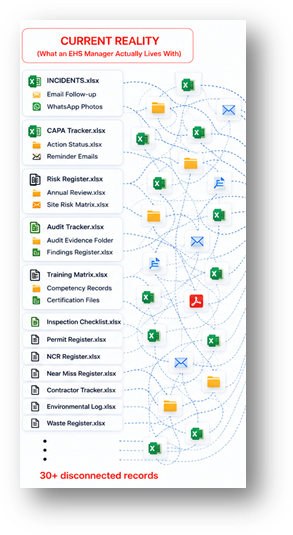
Current reality

That gap is not a technology footnote - it is the moment an HSE manager's credibility, and sometimes a facility's license to operate, gets tested. An auditor requests every CAPA raised from contractor incidents across three sites in the last twelve months. A regional director asks whether the same root cause has surfaced in more than one RCA this year. A regulator reviewing a facility governed by OSHA 1910.119 asks for documented evidence that a Management of Change (MOC) review was closed before a process modification went live. In each case, the answer exists somewhere in a spreadsheet - but โ€œsomewhereโ€ is not an acceptable answer when lives, licenses, and liability are on the line.

This is not a criticism of the people who build these spreadsheets. Some of the most sophisticated risk-tracking tools in the industry are workbooks built by HSE professionals who understand their operations in detail - nested formulas, conditional formatting, dropdown validation, macro-driven dashboards. The craftsmanship is rarely the problem. The architecture is. The spreadsheet was built to organize information inside a file. It was never built to hold operational relationships together - incident to RCA, RCA to CAPA, CAPA to verified effectiveness - across multiple sites, shifts, contractors, and reporting periods.

The consequences follow a predictable pattern. They rarely surface during routine operations. They surface during a SIMOPS-heavy turnaround, in the weeks following a contractor injury, or during the document-review phase of a regulatory audit - precisely the moments an HSE function most needs its data to hold up under scrutiny.

The Weekly Meeting Where Every Department Brings a Different Version of the Truth

Every HSE manager has sat through this meeting. Operations brings a printed incident summary from Tuesday. Contractor management brings a CAPA tracker last updated Thursday. The site brings inspection findings compiled that morning. None of the numbers reconcile, and the meeting spends twenty minutes establishing whose version is current before it can discuss whose version is correct.

This is not a communication failure between departments. It is the structural outcome of running enterprise-level HSE management through file-based tools. Each additional spreadsheet, each additional local copy downloaded โ€œjust in case,โ€ each additional email attachment adds another possible version of operational reality. By the time corporate HSE consolidates monthly reporting, several versions of the same underlying event may exist - each accurate at the moment it was captured, and each slightly wrong by the time it is read.

The Visibility Decay Model: How Spreadsheet-Based HSE Data Loses Integrity Over Time

This pattern has a shape, and it is worth naming, because naming it is the first step toward managing it. We call it the Visibility Decay Model - a three-stage progression describing how HSE data quality degrades as spreadsheet-based systems are stretched across multiple sites, contractors, and reporting cycles.

STAGE 1 - FRAGMENTATION 

Data is accurate but scattered. Incidents, CAPAs, inspections, audits, and risk registers each live in a separate file, maintained by a separate owner, on a separate schedule. 

STAGE 2 - LATENCY 

The gap between when an event occurs and when it becomes visible to decision-makers widens. Overdue CAPAs and recurring near misses go unmatched because nothing links the records. 

STAGE 3 - BLINDNESS 

By the time a consolidated view is requested - for a board report or a regulator - the organisation can no longer reconstruct, with confidence, what happened and what was done about it. 

This is the operating principle behind SOAPBOX.CLOUD.

What Fragmented Visibility Actually Costs

The instinct is to treat this as an administrative inconvenience - extra hours spent reconciling files before a board meeting. The real cost sits further upstream, in the frequency and severity of the incidents themselves.

2.3M+ deaths worldwide, annually.  - International Labour Organization (ILO), global estimate on work-related accidents and disease. 

$150B+ in annual U.S. workplace injury costs.  - National Safety Council, Injury Facts. 

12,000+ U.S. facilities covered.  - OSHA, Process Safety Management standard, 29 CFR 1910.119. 

Hundreds of thousands of non-fatal injuries annually in Great Britain.  - HSE UK, Labour Force Survey-based estimates. 

CCPS guidance on process safety metrics has long emphasised that the value of a corrective action programme lies in verified effectiveness, not closure rate - a CAPA marked โ€œclosedโ€ is not the same as a CAPA proven to have removed the hazard it was raised against. None of these figures describe a spreadsheet failure directly. What they describe is an environment in which the margin for undetected recurring risk is small, and the cost of missing a pattern - because it was recorded in a file nobody cross-referenced - is measured in incidents, not inconvenience.

RCA, MOC, and SIMOPS: Where Disconnected Systems Create the Most Risk

Root cause analysis without linkage

An RCA is only as useful as its connection to what happens next. When the RCA lives in one file, the CAPA it generates lives in another, and no structural link exists between them, verification becomes a manual reconciliation exercise. It is common, under this model, for the same root cause - a bypassed interlock, an inadequate permit review, a training gap - to appear in RCAs at two different sites months apart, unrecognised as a pattern because nothing prompted anyone to compare them.

MOC review without an audit trail

Process Safety Management under 1910.119 requires that changes to process chemicals, technology, equipment, or procedures go through a documented MOC review before implementation. When MOC approvals live in email threads and static forms, reconstructing a clean audit trail - who approved what, when, against which risk assessment - during a compliance inspection becomes a research project rather than a retrieval task.

SIMOPS without shared visibility

During a turnaround, multiple contractors frequently work simultaneous operations in overlapping zones. Permit conflicts, isolation boundary changes, and observation reports need to be visible in real time across crews that do not share a reporting system. API RP 754's emphasis on tiered process safety indicators assumes the underlying data is connected enough to be aggregated meaningfully - an assumption that fails when each contractor is submitting isolated spreadsheets on its own schedule.

What a Connected HSE Environment Looks Like in Practice

None of this argues that the spreadsheet is a poor tool. It argues that the spreadsheet is the wrong layer for holding enterprise-wide operational relationships once an organisation crosses a certain scale. A connected HSE environment does not eliminate the data HSE teams already collect - it links it. Incidents connect to their RCAs. RCAs connect to their CAPAs. CAPAs connect to verification evidence, not just a closed-date field. Inspections and audits connect to the risk assessments they validate or challenge. MOC records connect to the process safety information they modify.

                                      From 80+ disconnected records to one connected operational dashboard the shift a linked HSE environment makes possible.

The practical difference shows up in exactly the moments described earlier. Instead of an HSE manager combining five files before a board update, the exceptions - the overdue CAPA, the recurring near miss, the MOC pending sign-off - surface on their own. Instead of days spent assembling audit evidence, the evidence already exists in a structure a regulator can navigate directly. Instead of asking whether an action was closed, leadership can ask whether it worked - and get an answer supported by data rather than a status field.

The Question the Spreadsheet Cannot Answer

An HSE manager can build the most disciplined spreadsheet system in the industry - correct formulas, clean formatting, rigorous version control - and it will still fail to answer one question on demand: show me, right now, every corrective action tied to a repeat root cause across the portfolio, with evidence that each one actually worked.

That question requires linkage the spreadsheet was never architected to hold. It is not a question of effort, discipline, or spreadsheet design - it is a question of whether the system connects events to causes to actions to verified outcomes, or simply stores them next to each other. 


Every audit, every investigation, and every board request for assurance eventually reduces to some version of that question. The organisations that can answer it in minutes are operating from a connected system. The organisations that cannot are operating on trust - trust that nothing important has been missed between one spreadsheet and the next.

Why Formatted Spreadsheet Systems Fail HSE Managers in Oil & Gas Operations

Most spreadsheet-based HSE systems are updated every week. Far fewer are trusted the day an auditor, an incident investigator, or a corporate EHS director asks a question that spans more than one file.

That gap is not a technology footnote - it is the moment an HSE manager's credibility, and sometimes a facility's license to operate, gets tested. An auditor requests every CAPA raised from contractor incidents across three sites in the last twelve months. A regional director asks whether the same root cause has surfaced in more than one RCA this year. A regulator reviewing a facility governed by OSHA 1910.119 asks for documented evidence that a Management of Change (MOC) review was closed before a process modification went live. In each case, the answer exists somewhere in a spreadsheet - but "somewhere" is not an acceptable answer when lives, licenses, and liability are on the line.

This is not a criticism of the people who build these spreadsheets. Some of the most sophisticated risk-tracking tools in the industry are workbooks built by HSE professionals who understand their operations in detail - nested formulas, conditional formatting, dropdown validation, macro-driven dashboards. The craftsmanship is rarely the problem. The architecture is. The spreadsheet was built to organize information inside a file. It was never built to hold operational relationships together - incident to RCA, RCA to CAPA, CAPA to verified effectiveness - across multiple sites, shifts, contractors, and reporting periods. 

The consequences follow a predictable pattern. They rarely surface during routine operations. They surface during a SIMOPS-heavy turnaround, in the weeks following a contractor injury, or during the document-review phase of a regulatory audit - precisely the moments an HSE function most needs its data to hold up under scrutiny.

The Weekly Meeting Where Every Department Brings a Different Version of the Truth

Every HSE manager has sat through this meeting. Operations brings a printed incident summary from Tuesday. Contractor management brings a CAPA tracker last updated Thursday. The site brings inspection findings compiled that morning. None of the numbers reconcile, and the meeting spends twenty minutes establishing whose version is current before it can discuss whose version is correct.

This is not a communication failure between departments. It is the structural outcome of running enterprise-level HSE management through file-based tools. Each additional spreadsheet, each additional local copy downloaded "just in case," each additional email attachment adds another possible version of operational reality. By the time corporate HSE consolidates monthly reporting, several versions of the same underlying event may exist - each accurate at the moment it was captured, and each slightly wrong by the time it is read. 

The Visibility Decay Model: How Spreadsheet-Based HSE Data Loses Integrity Over Time

This pattern has a shape, and it is worth naming, because naming it is the first step toward managing it. We call it the Visibility Decay Model - a three-stage progression describing how HSE data quality degrades as spreadsheet-based systems are stretched across multiple sites, contractors, and reporting cycles.

Stage 1 - Fragmentation: Data is accurate but scattered. Incidents, CAPAs, inspections, audits, and risk registers each live in a separate file, maintained by a separate owner, on a separate schedule.

Stage 2 - Latency: The gap between when an event occurs and when it becomes visible to decision-makers widens. Overdue CAPAs and recurring near misses go unmatched because nothing links the records.

Stage 3 - Blindness: By the time a consolidated view is requested - for a board report or a regulator - the organisation can no longer reconstruct, with confidence, what happened and what was done about it.

This is the operating principle behind SOAPBOX.CLOUD.

What Fragmented Visibility Actually Costs

The instinct is to treat this as an administrative inconvenience - extra hours spent reconciling files before a board meeting. The real cost sits further upstream, in the frequency and severity of the incidents themselves.

2.3M+ deaths worldwide, annually. - International Labour Organization (ILO), global estimate on work-related accidents and disease.

$150B+ in annual U.S. workplace injury costs. - National Safety Council, Injury Facts.

12,000+ U.S. facilities covered. - OSHA, Process Safety Management standard, 29 CFR 1910.119.

Hundreds of thousands of non-fatal injuries annually in Great Britain. - HSE UK, Labour Force Survey-based estimates.

CCPS guidance on process safety metrics has long emphasised that the value of a corrective action programme lies in verified effectiveness, not closure rate - a CAPA marked "closed" is not the same as a CAPA proven to have removed the hazard it was raised against. None of these figures describe a spreadsheet failure directly. What they describe is an environment in which the margin for undetected recurring risk is small, and the cost of missing a pattern - because it was recorded in a file nobody cross-referenced - is measured in incidents, not inconvenience.

RCA, MOC, and SIMOPS: Where Disconnected Systems Create the Most Risk

Root cause analysis without linkage

An RCA is only as useful as its connection to what happens next. When the RCA lives in one file, the CAPA it generates lives in another, and no structural link exists between them, verification becomes a manual reconciliation exercise. It is common, under this model, for the same root cause - a bypassed interlock, an inadequate permit review, a training gap - to appear in RCAs at two different sites months apart, unrecognised as a pattern because nothing prompted anyone to compare them.

MOC review without an audit trail

Process Safety Management under 1910.119 requires that changes to process chemicals, technology, equipment, or procedures go through a documented MOC review before implementation. When MOC approvals live in email threads and static forms, reconstructing a clean audit trail - who approved what, when, against which risk assessment - during a compliance inspection becomes a research project rather than a retrieval task.

SIMOPS without shared visibility

During a turnaround, multiple contractors frequently work simultaneous operations in overlapping zones. Permit conflicts, isolation boundary changes, and observation reports need to be visible in real time across crews that do not share a reporting system. API RP 754's emphasis on tiered process safety indicators assumes the underlying data is connected enough to be aggregated meaningfully - an assumption that fails when each contractor is submitting isolated spreadsheets on its own schedule.

What a Connected HSE Environment Looks Like in Practice

None of this argues that the spreadsheet is a poor tool. It argues that the spreadsheet is the wrong layer for holding enterprise-wide operational relationships once an organisation crosses a certain scale. A connected HSE environment does not eliminate the data HSE teams already collect - it links it. Incidents connect to their RCAs. RCAs connect to their CAPAs. CAPAs connect to verification evidence, not just a closed-date field. Inspections and audits connect to the risk assessments they validate or challenge. MOC records connect to the process safety information they modify.

The practical difference shows up in exactly the moments described earlier. Instead of an HSE manager combining five files before a board update, the exceptions - the overdue CAPA, the recurring near miss, the MOC pending sign-off - surface on their own. Instead of days spent assembling audit evidence, the evidence already exists in a structure a regulator can navigate directly. Instead of asking whether an action was closed, leadership can ask whether it worked - and get an answer supported by data rather than a status field.

The Question the Spreadsheet Cannot Answer

An HSE manager can build the most disciplined spreadsheet system in the industry - correct formulas, clean formatting, rigorous version control - and it will still fail to answer one question on demand: show me, right now, every corrective action tied to a repeat root cause across the portfolio, with evidence that each one actually worked.

That question requires linkage the spreadsheet was never architected to hold. It is not a question of effort, discipline, or spreadsheet design - it is a question of whether the system connects events to causes to actions to verified outcomes, or simply stores them next to each other.

Every audit, every investigation, and every board request for assurance eventually reduces to some version of that question. The organisations that can answer it in minutes are operating from a connected system. The organisations that cannot are operating on trust - trust that nothing important has been missed between one spreadsheet and the next.

Post Author

MM

Mohammed Moizuddin

Founder & CEO

LinkedIn โ†’
Share this article
Table of Contents

    Related Articles

    The Human Factor in EHS Has Always Been Misunderstood
    Apr 20, 2026
    The Human Factor in EHS Has Always Been Misunderstood

    The EHS Intelligence Deficit Why the 'human error' root cause label is costing regula...

    Your EHS Setup Has Gaps. The Question Is โ€” Which Ones?
    Apr 20, 2026
    Your EHS Setup Has Gaps. The Question Is โ€” Which Ones?

    THE MARKET NOBODY SERVED 70% of Industrial SMEs Still Run on Spreadsheets. The E...

    Why Integration of Functional Roles Is the Key to Integrated HSE Management
    Jul 23, 2026
    Why Integration of Functional Roles Is the Key to Integ...

    Most CAPAs are closed. Far fewer are proven effective. That gap rarely originates in the c...

    Language